
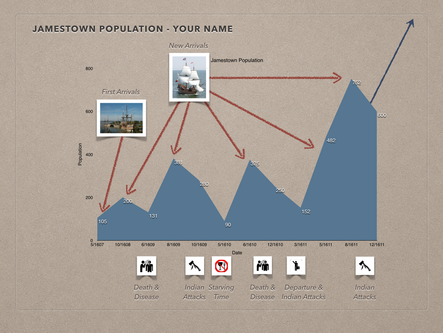
Today we wrapped up the Jamestown Infographics project by talking about what we learned about the Jamestown Colony population in the early years. The students talked about:
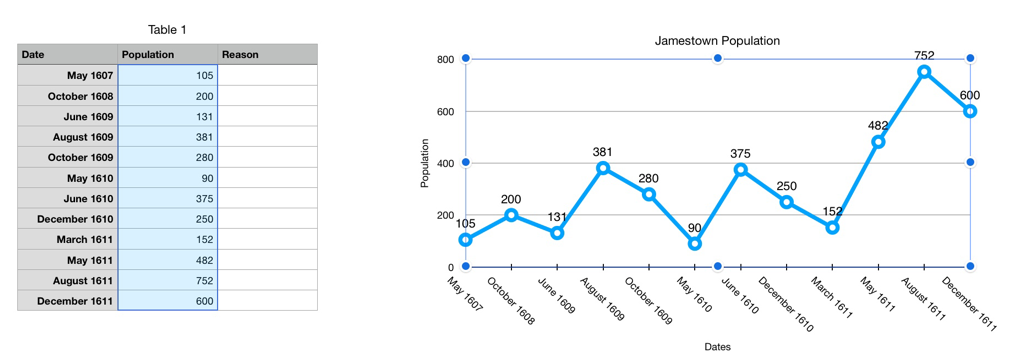
I showed the students a spreadsheet that looked similar to theirs, but I added a column that included the incremental population changes (theirs only included total population). Then we did some "what if" scenarios. What if new arrivals never came in August 1609? It was easy to see from the graph that the colony would've collapsed and who knows how that could've affected history. The same is true for the other ships bringing new arrivals.
We talked about how spreadsheets are used to calculate, analyze, and graph data.
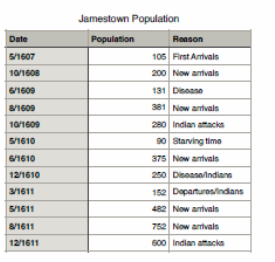
- how the population fluctuated - up and down
- the primary reason the population went up was because of "new arrivals"
- there were many reasons the population declined including: starvation, Indians, disease, and people returning to England
I showed the students a spreadsheet that looked similar to theirs, but I added a column that included the incremental population changes (theirs only included total population). Then we did some "what if" scenarios. What if new arrivals never came in August 1609? It was easy to see from the graph that the colony would've collapsed and who knows how that could've affected history. The same is true for the other ships bringing new arrivals.
We talked about how spreadsheets are used to calculate, analyze, and graph data.
 RSS Feed
